Table of Contents
Later this year in November, 2023, my paper was published in the BNR Economic Review which is a biannual journal of the National Bank of Rwanda (BNR/NBR). The article was titled “Drivers of Inflation Dynamics during the Pandemic: Evidence from Disaggregated Consumption Data“ [1]Manayubahwe, K., L. & Afolabi, L. (2023). The Drivers of Inflation Dynamics during Pandemic in Rwanda: Evidence from Disaggregated Consumption Data. BNR Economic Review, 20(2). Kigali, Rwanda.. In this writing I try to clearly explain what it was about and why I really wanted to talk about “Inflation Dynamics during the Pandemic”.
Introduction
The pandemic was a very big hit and we (economies) are still feeling the tremor due to the extent of its disturbance to economic activities. However, apart from the whole pandemic effect which economic activities were really affected by the pandemic, and how did it affect the prices?
That’s how the objective of the study was to understand the drivers (what driven) of inflation (prices) dynamics (movements) during the pandemic using evidence from disaggregated consumer price indices as they can measure the cost of consumption, hence inflation.
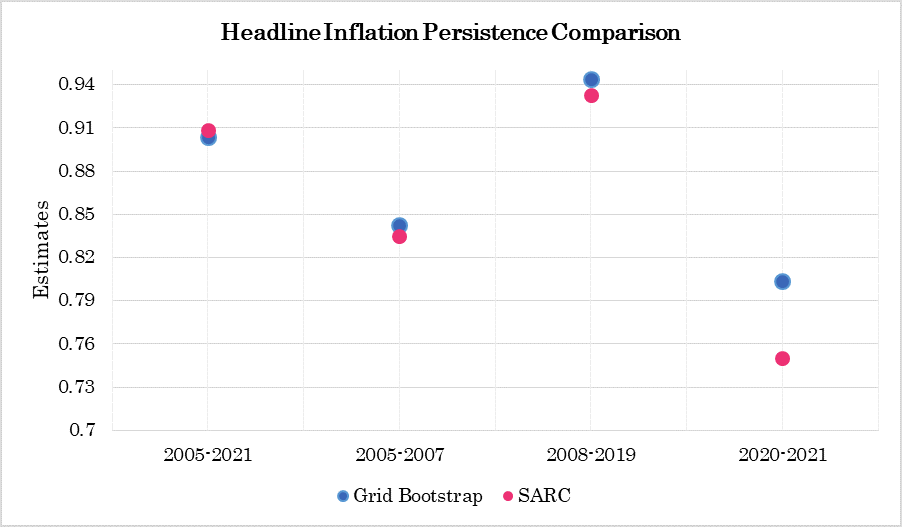
This research was meant to communicate on how inflation was like in those periods. This paper used the consumer price index data from National Institute of Statistics of Rwanda (NISR) that spans between January 2020 until December 2021 to capture the pandemic. It used persistence as a measure of how long it takes an inflation component alongside the aggregate inflations of headline and core (which is headline less volatile components) to return to the prepandemic levels after the pandemic shock (presumably).
The components that I considered in this study apart from headline and core inflation are food, energy, and transport inflation.
Why transport then?
Why transport mattered in this study if the pandemic was largely characterized by the lockdowns? The transport was a big player during the pandemic in Rwanda because in fact, the transport inflation became relatively high in pandemic periods compared to other periods.
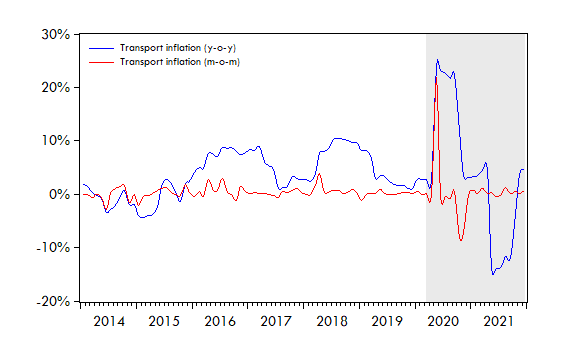
The above figure shows how inflation levels in transport were higher (year-on-year) throughout the first half of 2020, this increase was cut short by the downward revision of transport fares. That is why the transport inflation attracted my attention to understand the persistence of shock from the pandemic to vanish.
Method of calculating inflation dynamics
The method used in the paper says something simple:
"After this long period, how much of the shock is still remaining in this inflation component? Hence, if for this period there is still higher portion of effects of shock we say that this inflation is highly persistent."
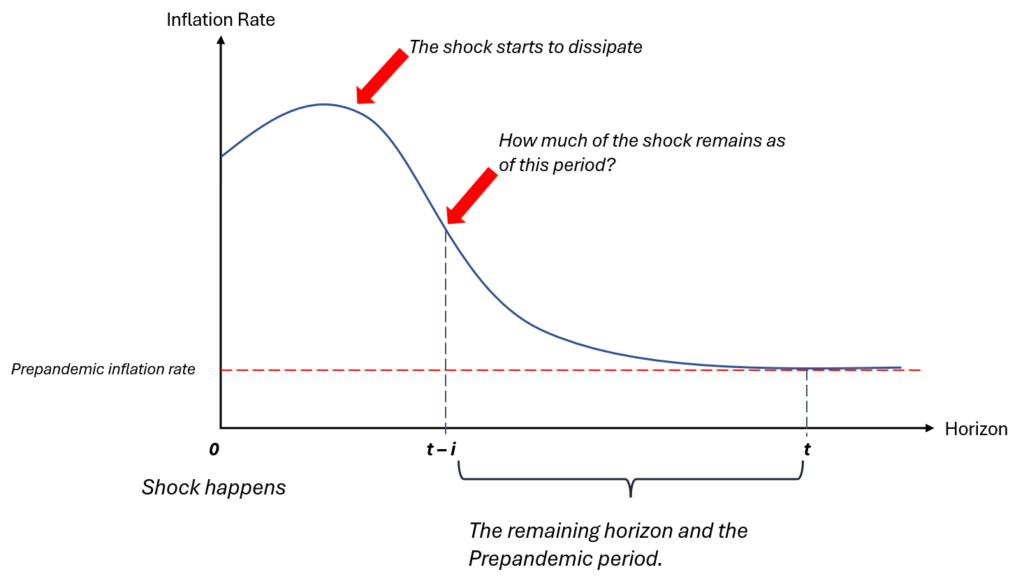
The above figure show how we quantify inflation persistence. If let’s say that t=t-i, the inflation would be full recovered to the prepandemic period. Otherwise, from the case we have in the above figure inflation will only be recovered at roughly 50% from the prepandemic inflation levels.
To write the above figure into sophisticated mathematical manner, we would write it in this way:

Or alternatively:

The  is the inflation at the current period,
  is a shock, and
  is the degree of persistence.
Results
It was clear that during the pandemic, headline inflation was relatively persistent (shocks were relatively resistant) compared to core inflation unlike other periods that were considered in the study1. This effect is not a single-view phenomenon because the pandemic was a mix of both demand and supply side disruption mix.
On the other hand, as shown in the previous figure, the transport inflation was higher, hence, there was a lower decline in persistence of transport inflation during the pandemic, but instead relatively persistent compared to for example, energy and food.
The trickier part of the results that is paradoxical is how headline inflation is more persistent during the pandemic compared to core inflation despite the lower levels of persistence in volatile groups of food and energy inflation. This triggers the need for consideration of closer analysis of headline inflation compared to core inflation.
These paper is composed of two different methodologies to ensure the consistency of the results, and the results show consistency in the results.
Recommendation
Upon the above analysis, the results show that the headline inflation dynamics are not necessarily affected by the volatile components, hence this would suggest a need for equal attention into investigation of inflation dynamics between headline and core inflation.
The focus on both inflation groups would help the central bank to avoid biased decisions.
In case you want to read full paper thoroughly, it is titled “Drivers of Inflation Dynamics during the Pandemic in Rwanda: Evidence from Disaggregated Data.“
It was authored by Manayubahwe Kazana Leonidas, and Dr. Afolabi Luqman, and was released in BNR Economic Review Vol. 20 No. 2 (2023) in November, 2023.
Footnotes
- There 4 different samples including pandemic period (i.e., 2005-2021, 2005-2007, 2008-2019, and 2020-20221). ↩︎
References
| ↑1 | Manayubahwe, K., L. & Afolabi, L. (2023). The Drivers of Inflation Dynamics during Pandemic in Rwanda: Evidence from Disaggregated Consumption Data. BNR Economic Review, 20(2). Kigali, Rwanda. |
|---|
Comment
This is a greatly insightful article. Thank you for sharing.
Depending on the definition of core inflation you used, your results on the persistence of headline vs core need not be paradoxical.
The typical NISR definition of core items includes major core food and core transportation components, which were likewise highly volatile in the aftermath of the pandemic epidemic.
As you note out in the study and blog post, for transportation, it was the successive upward and downward revisions of bus fares (a core item).
In terms of core foods, I believe processed food items were fairly variable throughout the period in question due to swings in global food prices. Rwanda’s noted reliance on imported foods resulted in a natural pass-through to domestic costs.
Therefore, core wasn’t really sticky as typically suggested by the textbook view. Perhaps this (+ other identification considerations) could explain why you find lower shock persistence in core relative to headline.