
Table of Contents
Since 2020, the global economy has faced a significant challenge to its resilience. Economies saw a series of disturbances, namely the COVID-19 pandemic, which led to a disruption in the global value chain and resulted in a substantial increase in poverty [1]Bill and Melinda Gates Foundation estimated that almost 37 million more people were thrown into extreme poverty. Additionally, the Russia-Ukraine conflict adversely affected the supply of oil and gas food, and fertilizer. Developing countries, such as sub-Saharan Africa, were disproportionately affected compared to developed ones, leading to an exacerbation of disparities between Global North and Global South.
While price volatility was widespread across all nations, the specific movements varied. Certain countries experienced inflation hikes as a result of anticipated scarcity in the supply of goods and services during the lockdown. Conversely, in other countries, the inflation rate decreased as a result of reduced production leading to recession. For example Rwanda had an economic downturn of 3.4%. This was further evidenced by the central bank’s decision to loosen monetary policy stance by lowering the interest rate in an effort to stimulate economic recovery.
Inflation Trend in the Last Decades in Rwanda
There is an abundance of evidence that elucidates the influence of recent shocks on Rwanda’s inflation dynamics. However, it is important to analyze the specific patterns of inflation, particularly in terms of its frequency and volatility. A typical approach for understanding this is by comparing the movements and examining the diverse characteristics of monetary policy response and economic structure in Rwanda in relation to other economies. Based on our recent research, we show that 60% of inflation fall within the central bank’s tolerance ranges of 5±3% (i.e., between 2 and 8%) [2]Nyabagabo, T., T. & Manayubahwe, K., L. (2024). Monetary Policy and Inflation Tolerance Ranges: Applications to Rwanda. BNR Economic Review, 21(1). Kigali, Rwanda..
The post aims to prompt the reader to think about whether the inflation in Rwanda is well controlled compared to other economies. This post uses Uganda as a case study to compare it with Rwanda by examining the fluctuations in inflation and analyzing the monetary policy responses over a period of time.
Data and Method
To carry out this research, I used data from national statistics offices for the country I was comparing with Rwanda, in this case, Uganda Bureau of Statistics (UBOS) and Rwanda itself, National Institute of Statistics of Rwanda (NISR).
The data were extracted in form of indices which were later on been converted into year-over-year inflation as percentage.

Where  is inflation rate,
  is the consumer prrice index. To understand the noise, we used the simplified filtration method of obtaining the volatilities in the inflation by calculating the rolling average (i.e., moving average) [3]We disregarded the adjustment in seasonal movements for all cases as this also would be part of an indicator for volatility effects.. The rolling average will smoothen the series over a specified period of time. The moving average is defined as follows:

This method disregards the Phillips curve relationship. The volatilities in inflation were calculated as the difference between inflation levels and the trend.

In this analysis we used a moving average of 12 months.
Plotting
In this section, I wanted to plot the analytical outcomes of this post; first I analyse the volatility in the headline and core inflation. I then examine the central bank rate (CBR) to determine if it could potentially explain some of the movements observed in the analysis.
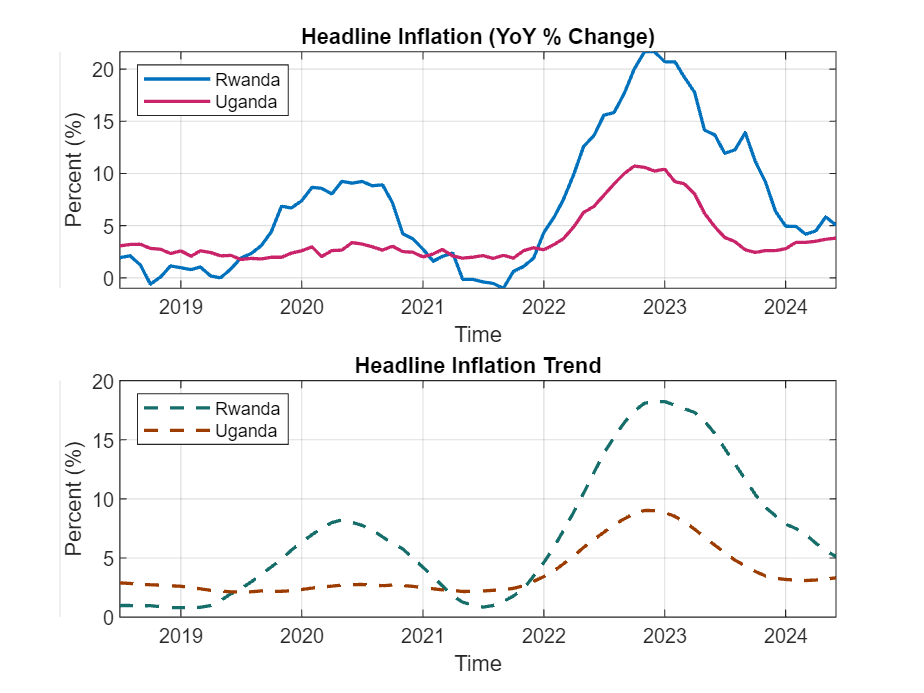
Headline Inflation
Based on the standard definition of headline inflation, this series includes price levels for energy and fresh food. Rwanda appears to have higher headline inflation than Uganda, with the exception of the periods from mid-2018 to mid-2019 and 2021.
It is evident that Rwanda occasionally experiences periods of deflation, such as October 2018 and October 2021, in contrast to Uganda, which has maintained positive inflation values over the period under consideration. The same applies when we compare the trends; additionally, Rwanda’s inflation trend is quite steeper in comparison to Uganda.
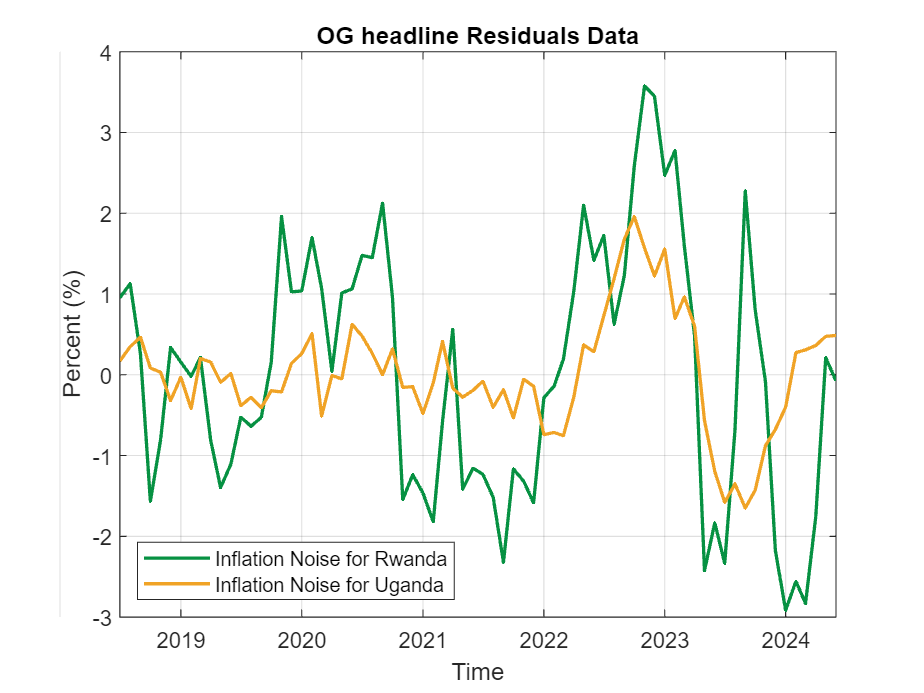
The differences in actual values and trend show large deviations of Rwandan headline inflation vis-à-vis that of Uganda. Rwanda’s inflation fluctuates more than its Ugandan counterpart when comparing the extracted residuals. We can think of two possible causes for this phenomenon: (1) the intensity of shocks in terms of transition; and (2) the monetary policy reaction efficiency. Therefore, we can apply the same analysis to core inflation to gain a deeper understanding of the differences.
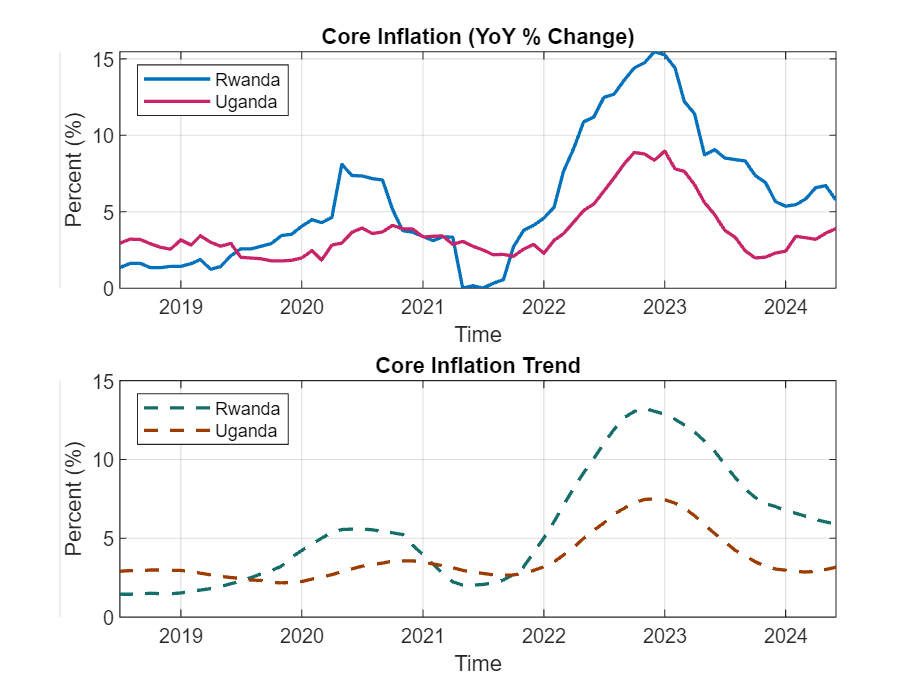
Core Inflation
To assess the differences and avoid biases embedded in volatilities of both fresh food and energy prices; I wanted to cross-check the results obtain in the analysis of headline inflation with the core inflation which is the headline less fresh food and energy prices. The difference between the two series is the thresholds and magnitudes, the headline threshold is more than 20% whereas the core is slightly above 15%.
As you would expect, the core inflation have lowest inflation levels where for all countries, the core rates are relatively small compared to the headline. It is documented that the core inflation tends to be relatively low and the best explainer of inflation trend [4]Mehra, Y. P., & Reilly, D. (2009). Short-term headline-core inflation dynamics. FRB Richmond Economic Quarterly, 95(3), 289-313..
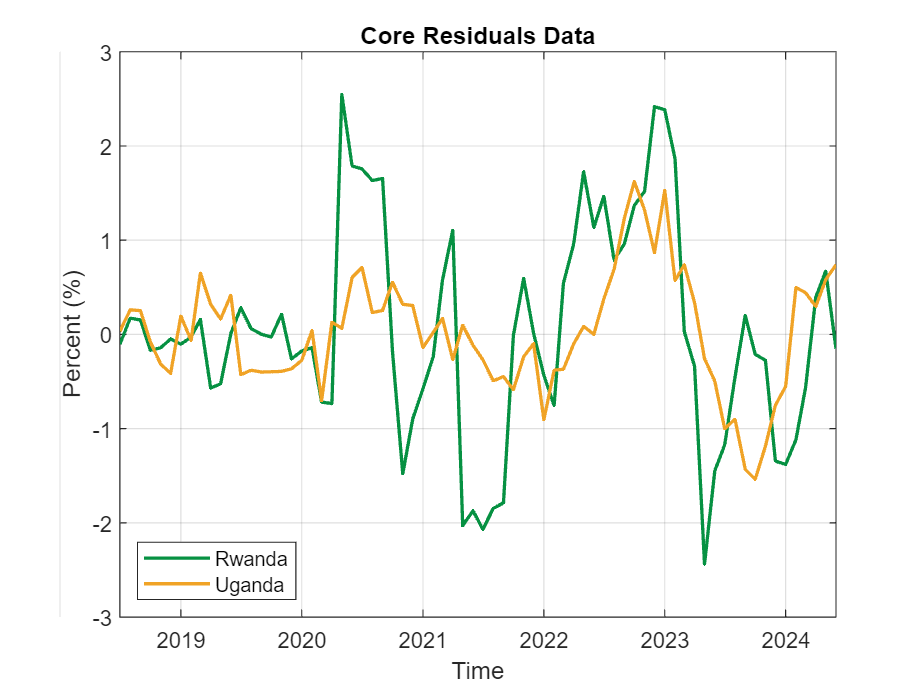
The story of deviations in the inflation between the two countries is the same for the core as it is in the headline. The main difference is that it seems that the deviations are broad-based except that we can say that from 2018 to 2020, the inflation was mainly driven by the volatile components of inflation as we see a less noisy inflation in that time.
Since 2020, there has been a noticeable increase in inflation discrepancies, with Rwanda seeing bigger deviations compared to Uganda, as is typically the case for the headline inflation as well.
Central Bank Rate
Since the central bank’s primary objective is to maintain price stability, it is essential to discuss the differences in monetary policy responses between the two countries. I primarily accomplish this by comparing the responses in monetary policy over time, which allows me to conclude whether the central bank modifies its instrument to account for inflation fluctuations. While it is understandable that there are numerous factors involved in the economy, this does not preclude me from conducting the analysis.
The central bank of Uganda exhibits a greater degree of proactivity in comparison to Rwanda, especially in times of crisis, perhaps leading to a prolonged lower inflation rate. Both Rwanda and Uganda had a significant reduction in policy rates throughout the pandemic era. More precisely, the policy rate in Rwanda reduced by almost 0.5 percentage points, whilst in Uganda it declined by more than 2.5 percentage points. Nevertheless, in 2022, with the beginning of the Russia-Ukraine war, the policy rates picked up again.
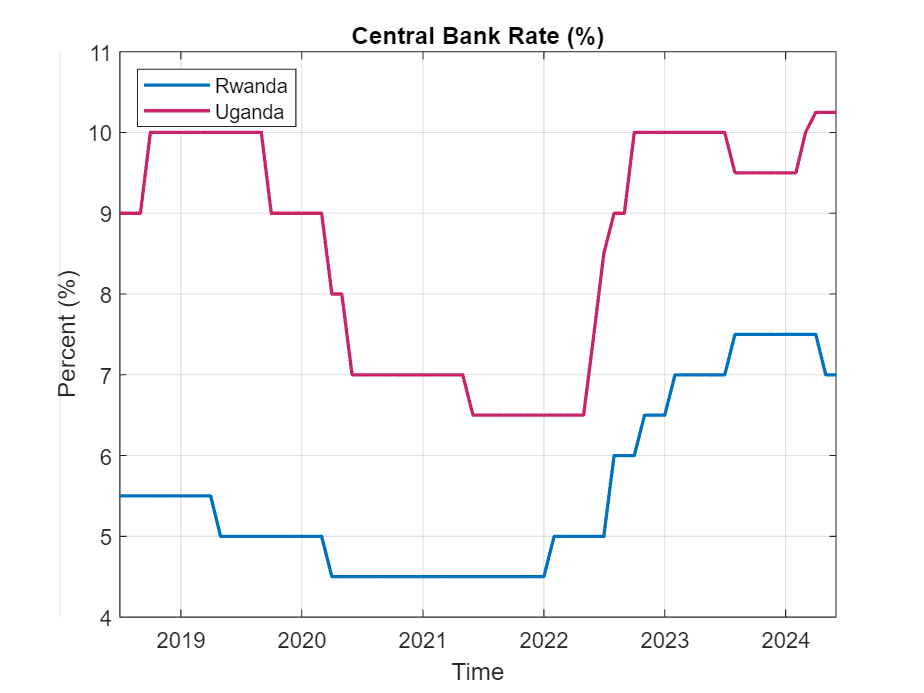
The overall picture of the monetary policy reaction based on this timeline shows that the central banks were following very well the flow of inflation chapters; for example, the loosening during the pandemic was a clear and justified decision, and vice versa during the period when the Russia-Ukraine war began. However, it’s worth considering whether the monetary policy’s response was sufficient to bring back inflation in the tolerance range or near the medium-term target.
The difference in the overall increase in policy rates between the two countries from 2022 to 2024 was 300 basis points for Rwanda and 350 basis points for Uganda. Upon analyzing the two responses to monetary policy, it is clear that the Bank of Uganda consistently exhibits aggressive conduct regardless of whether inflation is increasing or decreasing. In the first situation, the Central Bank of Uganda significantly cuts its central bank rate compared to Rwanda. In the second case, it raises the rate to a comparatively larger extent.
Conclusion
Based on the analysis in this post, there is proof of a negative correlation between the monetary policy position and the degree to which inflation diverges from its normal pattern. Therefore, if the central bank adopts a proactive approach, the deviations of inflation and its trend would reduce.
Upon examination of the data, it is clear that Rwanda may have made a deliberate decision to act with caution in adjusting its policy rate during periods of crisis due to different factors. This factor may have played a role in the significant fluctuation observed in inflation over a period of time. On the other hand, Uganda adopted a distinct strategy.
We cannot disregard other factors at play like financial stability concerns, the long lags in transmission and signals of the monetary policy reaction to economic agents, among other. All of these factors may influence significantly, and differ from country to country.
References
| ↑1 | Bill and Melinda Gates Foundation estimated that almost 37 million more people were thrown into extreme poverty |
|---|---|
| ↑2 | Nyabagabo, T., T. & Manayubahwe, K., L. (2024). Monetary Policy and Inflation Tolerance Ranges: Applications to Rwanda. BNR Economic Review, 21(1). Kigali, Rwanda. |
| ↑3 | We disregarded the adjustment in seasonal movements for all cases as this also would be part of an indicator for volatility effects. |
| ↑4 | Mehra, Y. P., & Reilly, D. (2009). Short-term headline-core inflation dynamics. FRB Richmond Economic Quarterly, 95(3), 289-313. |